One of the most common points of confusion for collectors of world silver coins is why identical-looking coins from the same country can have very different silver contents. A five-franc coin from one decade may be .835 silver, while another from the next decade drops to .720 or even .500, despite having the same design and denomination.
Understanding why silver purity changed over time is essential for accurately determining melt value, avoiding overpayment, and properly cataloging a collection. This guide explains how and why purity reductions occurred, what patterns collectors should recognize, and where mistakes are most often made.
Why Silver Purity Changed in World Coinage
Silver purity changes were rarely arbitrary. Most reductions were driven by a combination of:
- Rising silver prices
- Government budget pressures
- Currency debasement policies
- Wartime metal shortages
- Inflation and monetary reform
For many countries, silver coinage gradually shifted from monetary backing to token coinage, where face value exceeded intrinsic metal value.
Common Silver Purity Standards Used Worldwide
Before diving into specific countries, it helps to understand the most common silver fineness levels used globally:
| Silver Purity | Common Use |
|---|---|
| .900 | Early high-grade coinage (U.S., Latin Monetary Union) |
| .835 | Western Europe (France, Belgium, Switzerland) |
| .800 | Canada, Germany, Italy, Scandinavia |
| .720 | Mid-20th century debasement standard |
| .500 | Late-stage circulating silver |
| .400 and below | Transitional or last-issue silver |
These standards appear repeatedly across different countries and eras.
The Classic Purity Decline Pattern
Many nations followed a predictable progression:
High purity → reduced purity → low purity → elimination of silver
Collectors often encounter coins that look identical across this transition, making it easy to misjudge melt value.
Key Examples by Country
France: .835 → .680 → .500
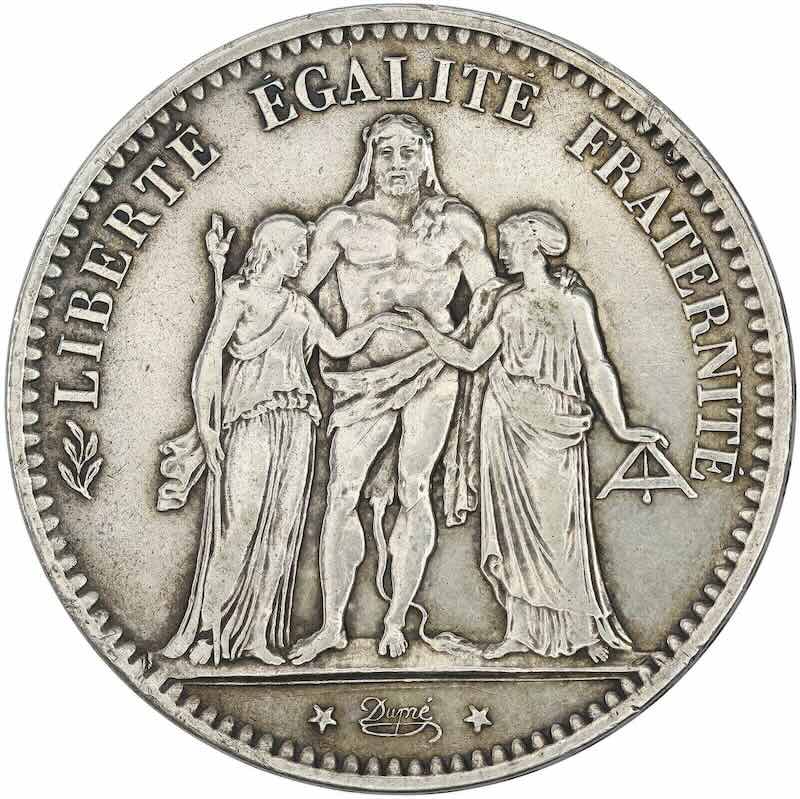
France’s silver coinage is a textbook example of gradual debasement.
- Pre-1920: .835 fine silver
- 1920s–1930s: Reduced fineness
- Post-WWII: .500 silver issues
- Later: Copper-nickel replacements
Collectors frequently overestimate melt value on later 5 Franc coins due to visual similarity.
Mexico: .720 → .500 → .300

Mexican silver coinage remained in circulation longer than most countries, but purity steadily declined.
- Early mid-century pesos: .720 silver
- Later circulation: .500 silver
- Final issues: .300 silver or lower
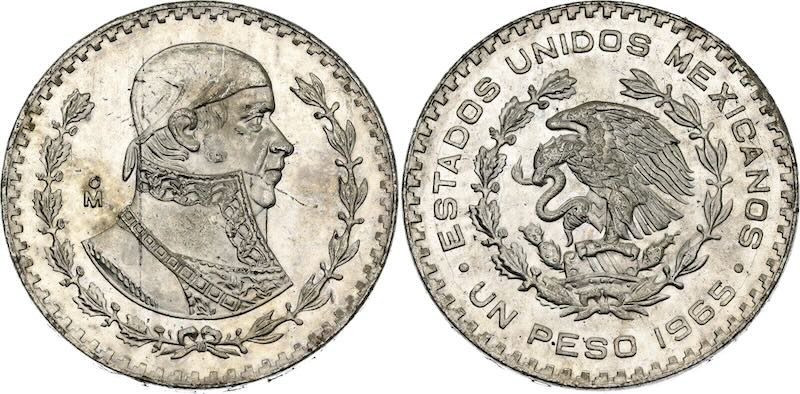
Some peso coins retain strong collector demand even when melt value is modest.
Canada: .925 → .800 → .500
Canada reduced silver content multiple times before eliminating it entirely.
- Pre-1920: Sterling silver (.925)
- 1920–1966: .800 silver
- 1967: Mixed .500 and .800 issues
- 1968 onward: No silver
The 1967 transitional year is especially confusing for collectors.
United Kingdom: .925 → .500 → None
British coinage shows one of the most dramatic silver shifts.
- Pre-1920: Sterling silver (.925)
- 1920–1946: .500 silver
- Post-1946: No silver content
Many British coins look identical across this divide but differ drastically in melt value.
Why Identical Coins Can Have Different Melt Values
Design continuity was common. Governments often retained:
- The same portraits
- The same denominations
- The same sizes
Only the metal composition changed. This means date matters more than appearance when determining melt value.
Transitional Years: The Collector Trap
Certain years contain mixed compositions, depending on mint or production batch.
Examples include:
- Canada (1967)
- Mexico (late 1940s–1950s)
- Several European post-war issues
Without composition verification, collectors can easily miscalculate silver content.
How Purity Changes Affect Melt Value
A drop from .835 to .720 silver represents a 14% reduction in silver content. A drop to .500 cuts intrinsic value nearly in half.
This makes purity one of the single most important variables in melt calculations—often more impactful than weight differences.
Best Practices for Collectors
To avoid errors:
- Always verify purity by date
- Do not assume uniform composition across a series
- Use country-by-era composition tables
- Cross-check melt value using trusted references
Relying on appearance alone is one of the most common mistakes new collectors make.
Why This Matters Even for Numismatic Collectors
Even when a coin’s value exceeds melt:
- Purity affects downside risk
- Melt establishes a pricing baseline
- Composition helps explain market behavior
Understanding purity changes deepens historical context and improves catalog accuracy.
Final Thoughts
Silver purity changes are not anomalies—they are a defining feature of 19th- and 20th-century world coinage. Recognizing these transitions allows collectors to evaluate coins accurately, avoid costly mistakes, and better understand the monetary history behind their collections.
Melt value begins with purity. Without it, every calculation is incomplete.
Educational Notice
This article is provided for informational and educational purposes only. It does not constitute financial, investment, or purchasing advice. Coin compositions and specifications vary by country and year; always verify details using authoritative numismatic references.